Low-emission choice for passengers
The high utilisation rate on Finnlines’ routes and ro-pax vessels guarantee the possibility to travel with low emissions. We want to improve the transparency and comparability of voyage emissions and have calculated passenger-specific carbon dioxide figures since 2019 on our passenger routes.
CO2 emissions comparison by travel mode
The data for calculations was gathered from public and third-party sources. To make the comparison viable and possible, actual transport modes were used and adjustments on some routes were necessary. For example, there are no flights Helsinki < > Travemünde, therefore, a similar, realistic option (Helsinki < > Hamburg) is presented.
Finland–Sweden
| Transport method | Route | Distance in km | kg CO2/pax one way |
| Finnsirius & Finncanopus | Naantali < > Kapellskär via Långnäs | 212 | 11,8 |
| Other vessels in traffic | Turku < > Stockholm via Mariehamn | 307 | 45,7 |
| Airplane | Turku < > Stockholm | 257 | 31 |
Finland–Germany
| Transport method | Route | Distance in km | kg CO2/pax one way |
| Finnstar, Finnlady & Finnmaid | Helsinki < > Travemünde | 1145 | 80,9 |
| Airplane | Helsinki < > Hamburg | 1168 | 158 |
| Car * | Helsinki < > Travemünde (via Baltica) | 1921 | 177,4 |
| Bus ** | Helsinki < > Travemünde (via Baltica) | 1921 | 74,2 |
* Total distance 1921 km (Google Maps). It consists of 1838 km by car and 83 km by ferry (based on the nautical miles of ferry route). The length of each leg multiplied by designated emission factor. For distance travelled by ferry, the average of kg CO2/pax of all ferries in traffic was used.
** Distance from Google Maps for car travel. Total distance 1921 km consist of 1838 km by car and 83 km by ferry (based on the nautical miles of ferry route). The length of each leg multiplied by designated emission factor. For distance travelled by ferry, the average of kg CO2/pax of all ferries in traffic was used.
Sweden–Germany
| Transport method | Route | Distance in km | kg CO2/pax one way |
| Finnfellow, Finnpartner, Finnswan & Finntrader | Malmö < > Travemünde | 255 | 12,3 |
| Other vessels in traffic | Trelleborg < > Travemünde | 224 | 126,9 |
| Airplane | Copenhagen < > Hamburg | 280 | 34 |
| Car* | Malmö < > Travemünde | 298 | 25,8 |
| Bus** | Malmö < > Travemünde | 298 | 10,3 |
* Distance from Google Maps. Emissions from Rødby–Puttgarden-ferry not included in calculations.
** Distance from Google Maps for car travel, the calculation doesn’t consider possible detours for buses. Emissions from Rødby–Puttgarden-ferry not included in calculations.
Sweden–Poland
| Transport method | Route | Distance in km | kg CO2/pax one way |
| Finnfellow, Finnpartner & Finntrader | Malmö < > Świnoujście | 244 | 12,8 |
| Other vessels in traffic | Trelleborg < > Świnoujście | 177 | 101,2 |
| Airplane | Malmö < > Warsaw | 568 | 72 |
| Car* | Malmö < > Świnoujście | 568 | 50,9 |
| Bus** | Malmö < > Świnoujście | 568 | 20,3 |
* Distance from Google Maps. Emissions from Rødby–Puttgarden-ferry not included in calculations.
** Distance from Google Maps for car travel, the calculation doesn’t consider possible detours for buses. Emissions from Rødby–Puttgarden-ferry not included in calculations.
What are these numbers based on?
What are these numbers based on?
Ferries: Greenhouse gas emission reports from shipping companies (MRV, 2025), specifically CO2 emissions per transport work. 1 The emissions are published in accordance with Article 21 of Regulation (EU) 2015/757 on the monitoring, reporting and verification of greenhouse gas emissions from maritime transport.
Airplanes: International Civil Aviation Organization’s (ICAO) Carbon Emissions Calculator. 2 The calculator applies publicly available industry data to account for various factors, such as aircraft types, route specific data, passenger load factors and cargo carried.
Cars: Calculations based on data from European Environmental Agency (2023) 3 and the calculation considers the EU average of 1,6 passengers per car. 4 An average EURO-class petrol car was chosen for passenger cars, as 65% of passenger cars in traffic are petrol driven in Finland. 5
Bus: Calculations based on data from European Environmental Agency (2023) 4 and the calculation considers an average of 20 passengers per bus.
Why are trains not included in the comparison?
Rail transport generally has low emissions, especially on electrified networks, but comparison requires public and comparable data and calculation methods. The emission calculator of International Union of Railways compares transport modes with well-to-wheel (WTW), while the presented calculations are tank-to-wheel. These values are not directly comparable and WTW data was not publicly available for all transport modes to enable comparison.
Why is the comparison with CO₂, and not CO₂equivalent (CO₂e)?
While CO₂e comparison would provide a more comprehensive measure of climate impact, comparable data is not publicly available for all transport modes. To ensure a consistent and fair comparison, the calculations are therefore based on CO₂ emissions only.
Sources
1. MRV, 2025. https://mrv.emsa.europa.eu/#public/emission-report
2. ICAO, n.a. https://icec.icao.int/Home/Index
3. European Environmental Agency, 2023. https://www.eea.europa.eu/en/analysis/publications/emep-eea-guidebook-2023?activeTab=13e424cd-5934-4614-92ef-e6be8d05c441
4. European Environmental Agency, 2000. https://www.eea.europa.eu/en/analysis/publications/envissueno12
5. Traficom, 2024. https://tieto.traficom.fi/sites/default/files/media/file/Liikennekaytossa-olevat-ajoneuvot-kayttovoimittain-aikasarja.xlsx
Environmental responsibility indicators
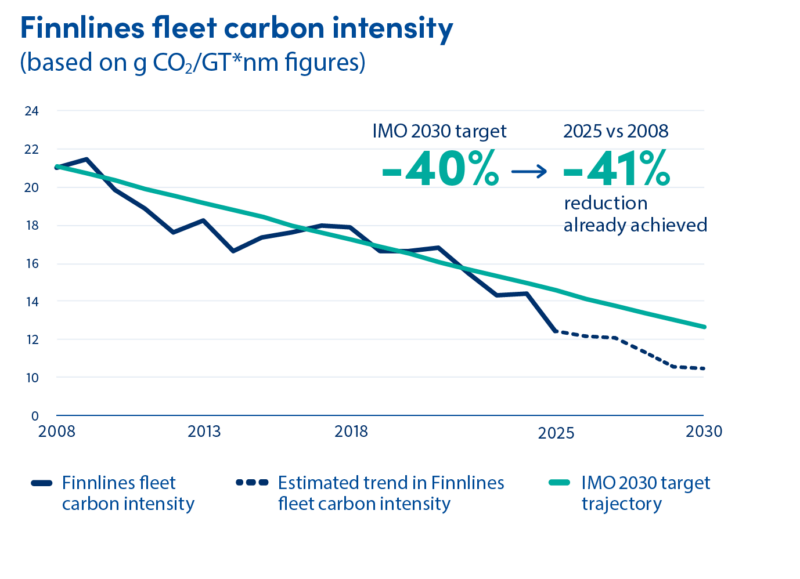
Fleet energy improvement, carbon
intensity reduction
2025 vs 2024
– 14%
12.5 g CO2/GTnm in 2025
14.5 g CO2/GTnm in 2024
Sustainability Review
2025
To advance these goals and report on our steps toward environmentally sustainable maritime transport, we published our first voluntary Sustainability Review on 13 March 2026.