Key figures 2025
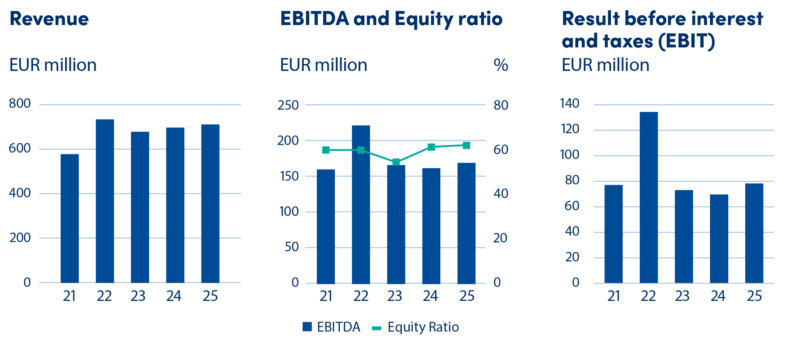
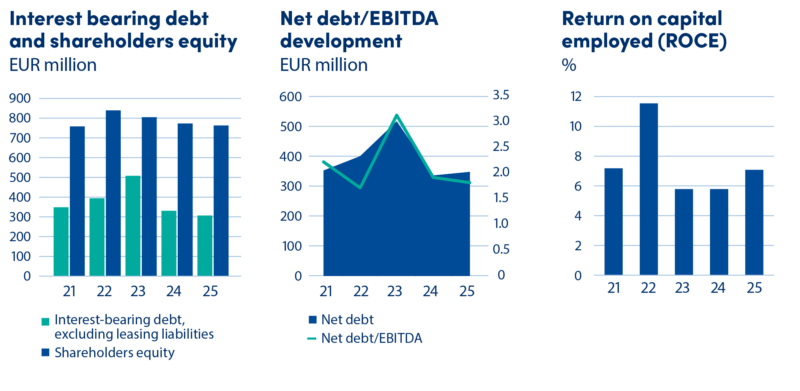
Key financial figures
Revenue by function
*Including internal revenue between the segments EUR 19.4 million.
Key operational figures
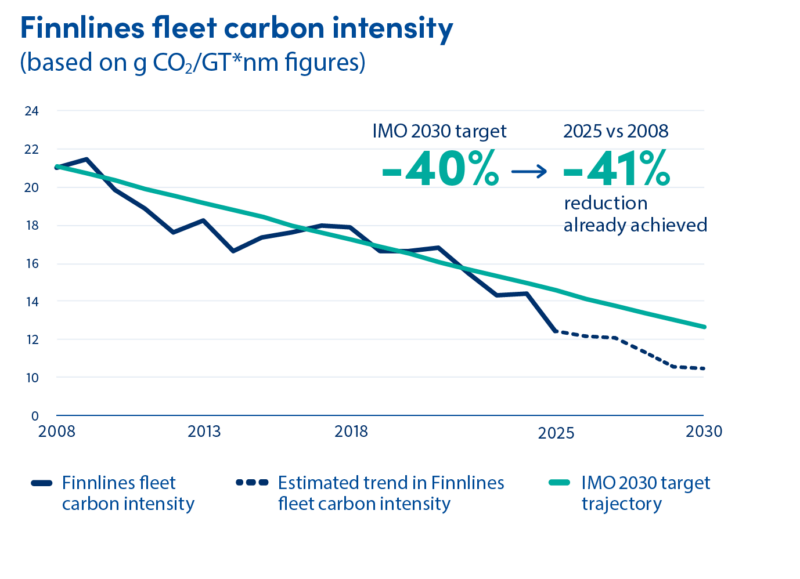
Key environmental figures
Fleet energy efficiency
improvement, carbon
intensity reduction
2025 vs 2024
-14%
12.5 g CO2/GTnm in 2025 14.5 g CO2/GTnm in 2024
Highlights 2025
CEO’s review 2025